

How to Play
Introduction
We built the Burrito Optimization Game as an educational tool. The game is intended to introduce learners to the idea of mathematical optimization. It teaches players a little bit about what optimization can do, what sorts of problems it can solve, why someone might want to use it, and what advantages it has over manual trial-and-error approaches.
If you’re looking for an overview of how to play the game, see the Game Guide. If you’re an instructor looking for some tips about how to teach using the game, you’re in the right place. This guide will provide a quick overview of how you might structure a lesson around the game, introduce the high-level concepts that the game can illustrate, and suggest some “aha!” moments that you can aim for during gameplay. The guide also includes slides and lesson plans that you can download and use in your class.
Lesson Plans and Slides
For anyone interested in teaching the game in a classroom or training setting, we’ve put together additional resources for you to use including a full lesson plan and a slide template that you can download and adapt to use when introducing the game to new learners.


Intended Audience
The game has a few different intended audiences. For example:
Data scientists: The game can help explore the question of “what’s next?” after forecasting, classification, sentiment analysis, or other data science task. That is, once you have data to describe or predict a system, how can you use those data to optimize the system?
Introductory operations research (OR) students: Students’ first exposure to optimization is often through algebraic models and graphical diagrams. Why not start off with a game to introduce some of the “why?” behind optimization?
Anyone who needs a demonstration that optimization is hard: If you think that it’s easy to optimize systems that involve many possible combinations, try doing it by hand and you’ll quickly see why optimization algorithms are essential to the modern world.
Younger students (bonus audience!): The game is a great tool for introducing younger students to the idea that there’s more to math than quadratic equations and Pythagorean triples. Math forms the basis of a powerful set of computational tools that are critical for real-world decision-making.
You may want to adjust the ideas discussed below to customize them for the particular group of learners you are working with.
Sample Lesson Structure
Before class
Read the Game Guide on your own.
Play through the whole game (both rounds, 10 days in total).
If you want your students to learn the mechanics of the game ahead of time, to save time in class, have them play through Round 1, Day 2. (Note: The game reveals the optimal solution at the end of each day, so students will come to class having already seen the first few optimal solutions.)
In class
Introduce the game. Discuss goals, rules, gameplay, etc.
Play 2 or 3 days of the game. Let students get a feel for the game.
Discussion. What seems easy or hard about locating burrito trucks? Did anyone find a solution that was close to optimal?
Finish Round 1. Students will work through a few new wrinkles (changing costs, different demand behaviors, increasing number of nodes).
Discussion. What strategy did you use? If you were going to design an algorithm to solve the problem (that is, to automate the work that you did by hand, and maybe do it better), what strategies might your algorithm use? What are the pros and cons of the different algorithmic ideas?
Choose one: Play Round 2 (which introduces demand uncertainty) or step away from the game for a few minutes to give an “optimization 101” primer (for example, high-level discussions of why enumeration is impractical, how to formulate a simple MIP, how branch-and-bound works, etc.).
Discussion. What surprised you about your experience playing the game, or about the discussion afterwards? Can you think of other real-world problems that might benefit from optimization? What mathematical/computational concepts that you have already learned might be useful in designing optimization models or algorithms?
After class
Championship mode (for homework, or in class if time permits): Students compete against each other to see who can find the best burrito-truck locations!
Dinner
Eat burritos!
Learning Objectives
High-level takeaways
If nothing else, players should come away from the game having learned these things:
Planning doesn’t end with forecasting. Finding the best site is one thing. Finding the best 10 is orders of magnitude harder.
Optimization by hand is hard. You might have done fine when there were, say, 15 possible spots to locate trucks. But what about if there were 50, or 500, or 5000 (as in many real-life situations)?
Optimization can be done by algorithms. Mathematical optimization is a mature scientific field with a well-developed theory and robust commercial and open-source software.
"Aha!" moments
There are many insights that you can highlight when your students are playing the game. Some of these will occur organically and you can discuss them when they do; others will require you to provide a bit more instruction to lead students to those moments. Here are some examples.
Tradeoffs
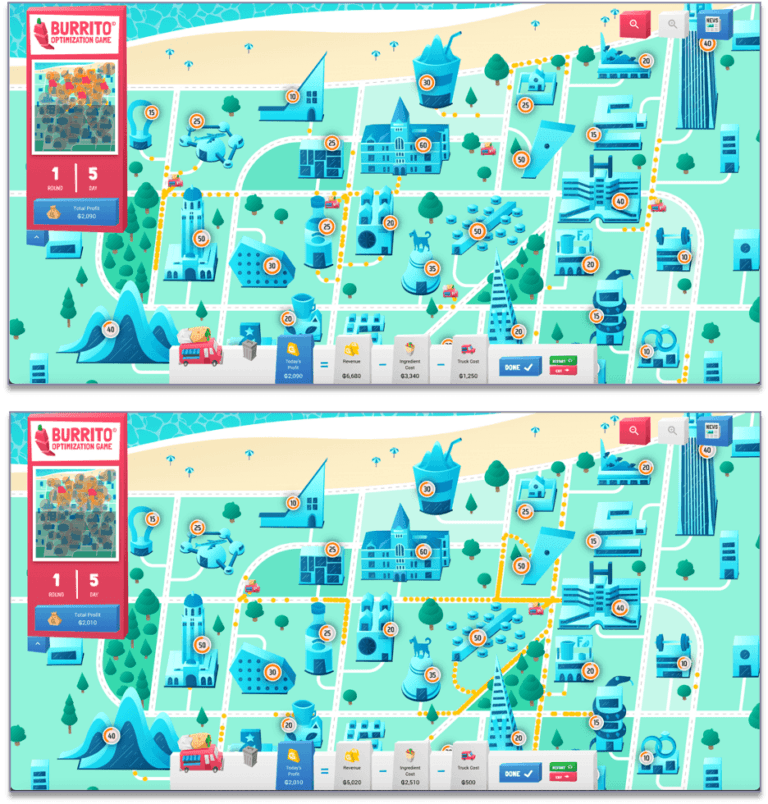
In the game, there is a tradeoff between (fixed) truck costs and (variable) revenues: The more trucks you open, the more you pay in truck costs but also the more net revenue you earn (and the more ingredient cost you pay). There is more than one way to navigate this tradeoff. For example, the solutions pictured have almost the same profit, but the top solution uses 5 trucks while the bottom solution uses 2.
Diminishing returns
The first truck you place in a given part of the city will usually have a big impact on your profit. The second truck will have a smaller impact, and subsequent trucks will each tend to have less impact, because the area becomes “saturated”—there is not enough demand to support the additional trucks. In the solutions pictured, the customers near the bottom of the first solution are already fairly well served; the second truck (in the second solution) will capture those customers but might not bring enough extra revenue.

Optimal solution depending on parameters
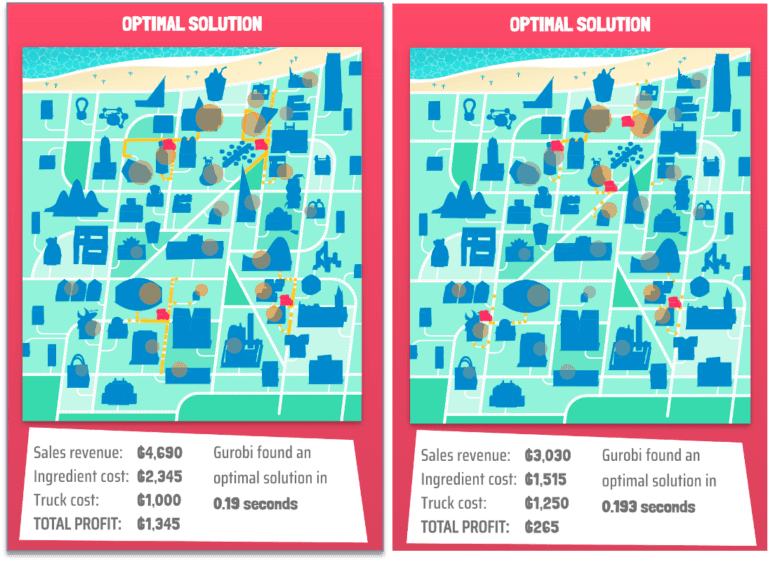
Although optimization is sometimes viewed as a black box by people new to the topic, optimal solutions still behave in predictable ways that students can anticipate. For example, if the ingredient cost per burrito increases, do you expect that the optimal profit will increase or decrease? (It shouldn’t be too hard for the class to realize that the optimal profit should decrease.) What about the optimal number of trucks—will that increase or decrease? (If the profit per burrito decreases, it takes more customers to offset the fixed cost of each truck. Therefore, the optimal number of trucks will probably decrease. This is more subtle and will probably require more guidance from the instructor for students to see it.) The optimal solution under the default settings uses 4 trucks (left-hand image), but when the ingredient costs double, the optimal solution uses 2 trucks (right-hand image).

On Day 3, the newsfeed says that it’s rainy, so customers are not willing to walk as far to buy burritos. Do we expect the optimal number of trucks to increase or decrease? This one is trickier: One could argue that, since each truck captures fewer customers, each truck is less profitable, and therefore we should open fewer trucks. Or one could argue that we should open more trucks since each one serves a smaller radius of buildings. The answer actually depends on the specific data: If the demand at each building is sufficiently large, it justifies opening more trucks to capture that demand, while if the demands are small, then it will be optimal to open fewer, or even zero, trucks. But the demands in the game are large enough that it is optimal to open more trucks. The optimal solution has 5 trucks (right-hand image), whereas we already know that the optimal solution under the default setting has 4 (left-hand image).
Greedy may not be optimal
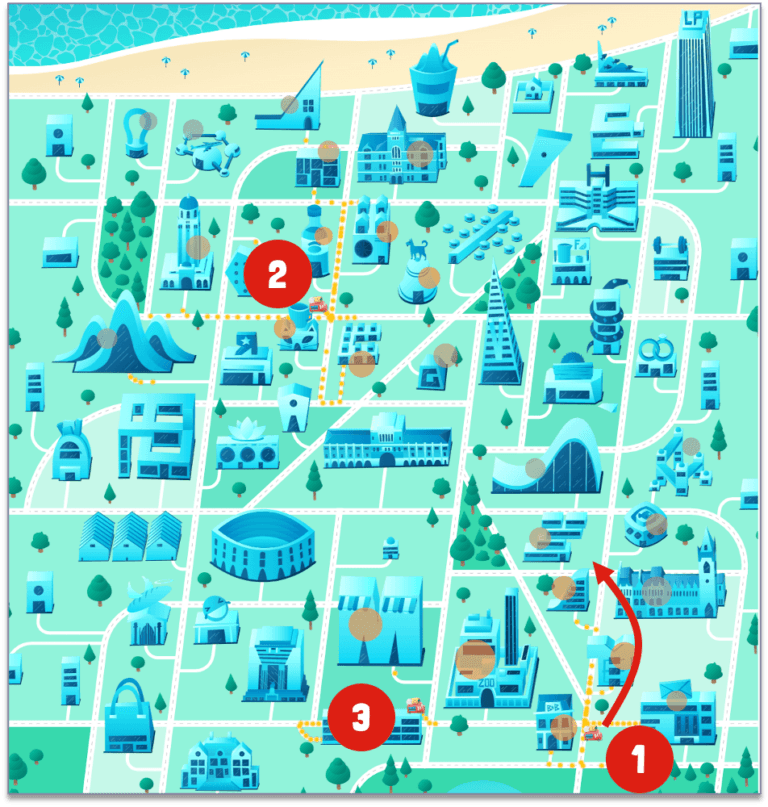
Many players take a greedy approach to locating trucks in the Burrito Optimization Game: First, open the truck at the location that gives the largest profit; then keep that truck open, find the location that increases the profit the most, and open a truck there; and continue until adding a truck at any spot would decrease the profit. The greedy approach is not optimal for this problem (it is a heuristic—an approximate algorithm), although it is for some problems, like the mininum spanning tree problem. For example, in the image below, the greedy approach would locate a truck at the spot marked 1, then 2, then 3, but then the original truck at spot 1 is no longer optimal; it is optimal to move it north a few blocks, as indicated on the figure. In other words, we cannot find the optimal solution using the greedy approach in this case.
How might an algorithm work?
If you were going to design an algorithm to solve the burrito-truck problem, how would your algorithm work? Students should brainstorm possible approaches. One way students can come up with an approach is to think about the steps that they took when they were trying to solve the problem, and then try to generalize that approach so that it can be automated. Possible responses from students might be:
A greedy approach, as discussed above
Some sort of partitioning approach: solve the problem in each quadrant of the city separately and then combine the solutions
Enumeration: program the computer to try every possible combination of truck locations
If enumeration enters the discussion, it presents a good opportunity to discuss why this approach is doomed to failure. For example, suppose we had a computer that could evaluate 1 billion solutions per second. Our computer could enumerate the solutions in Round 1, Day 1 very quickly: The problem has 16 allowable truck locations, so 216=65,536 solutions to evaluate, which our computer could do in less than 1 millisecond. But on Day 5 there are 56 locations and 2^56=72,057,594,037,927,900 solutions, which would take our computer 2.3 years! And if the problem had 100 locations, enumeration would take more than 40 trillion years! This motivates why we need smarter optimization algorithms, such as those that are “under the hood” of Gurobi or other exact solvers.
Uncertainty makes optimization harder
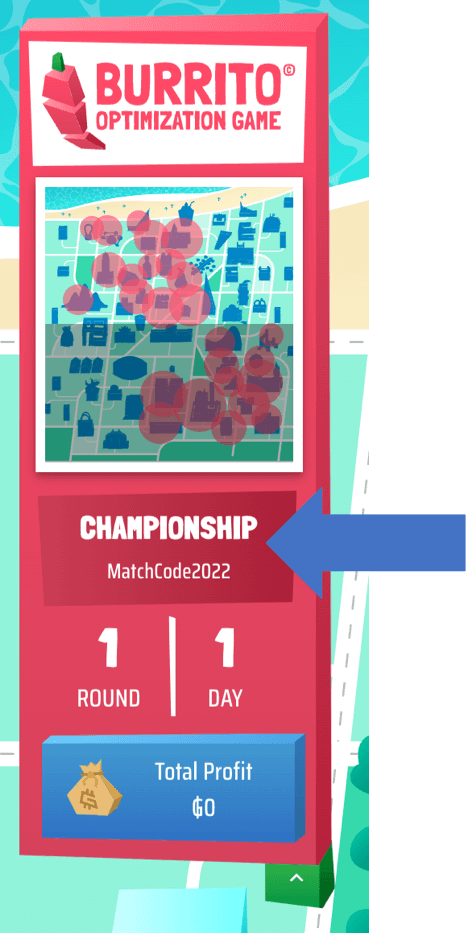
In Round 2, the demands become random: The player only knows forecasts of the demands when they choose truck locations (as does Gurobi), but the player’s solutions (and Gurobi’s) are evaluated using actual demands. Solutions that seemed good under the forecasts might perform quite poorly under actual demands. For example, the truck in the southwest quadrant of the city in the solution below looked attractive under the demand forecasts (dashed circles), which were large, but was probably not profitable under the actual demands (filled circles).

If desired, discuss various aspects of optimization under uncertainty, such as optimizing under multiple scenarios simultaneously (instead of optimizing under each scenario individually), as well as important metrics like regret, the expected value of perfect information, and the value of the stochastic solution.
Forecast bias changes the solution
On Days 4 and 5 of Round 2, error bars indicate the minimum and maximum possible values of the demands, and these are not always symmetrically spread around the forecast. Discuss whether we can make use of that information when planning truck locations. For example, if given a choice, should we locate in regions where the actual demands are likely to be higher than the forecasts, or lower? Students should realize that we would rather locate in regions where the actual demands are likely to be higher than the forecasts—where there is more upside potential and less downside risk.

IP basics
If desired, show students the integer programming (IP) formulation of the burrito-truck-location problem. (The formulation is given in the Game Guide.) This might just be a quick peek, to convince students that a formulation of this messy real-world problem really just looks like math—sums and subscripts and inequalities, etc. Or, go into more detail: discuss the notation, the definitions of an objective function and constraints, the use of binary variables to turn costs on and off or to impose logical constraints, etc.
The discussion about why enumeration is not practical will naturally lead to the question of what Gurobi’s solver is actually doing, if not enumerating. Here you can provide a quick overview of branch-and-bound, going into as much or as little detail as desired. A brief overview is provided in the Game Guide.
Championship mode
If desired, have the class play the game in Championship Mode after the end of the discussion. This can be in class or for homework. In Championship Mode, players compete to find the best solutions, and the players with the best total scores are listed on a Leaderboard. Championship Mode uses different datasets than the normal play mode, and the optimal solutions are kept secret.
Running a Championship game in your class:
Visit the game’s homepage and click on “championship mode”.
Create a unique “match code” that is less than 20 characters long. You can use a mix of letters and numbers for this match code.
NOTE: match codes are case-sensitive, and you don’t need to register your code before the competition (you just need to distribute the selected code and check to see that it isn’t already in use by testing a data download with your match code (see #7 below)).Distribute the assigned alphanumeric match code to your class and ask them to select “championship mode” from the game’s homepage when they are starting game play:

Run your Championship game.
Ask students to be sure to save their scores at the end of the game.
As the instructor, you will need to start a game using the match code that you created.
Within the championship game, you can click on the Championship button & match code to download the scores (with student aliases, timestamps, and scores) to view the results.
8.Good luck to your students and enjoy running a championship game with the class!
Game Tips
The game automatically generates tips that are displayed to players on the solution screen. These tips help explain the wrinkles/complexities, take advantage of teachable moments for players to improve, and highlight some of the suggested learning outcomes of the game.
